

Molecular Docking
Overview
Molecular docking is a computational technique used to predict how a small molecule (ligand) binds to a protein target. By exploring possible binding orientations and scoring the resulting interactions, docking helps researchers identify promising compounds for further investigation. LiteFold Molecular Docking provides an end-to-end workflow for predicting protein-ligand interactions. Users can select protein structures from project libraries, identify binding pockets manually or with AI-assisted detection, configure docking regions, screen ligands, visualize binding poses, and analyze molecular interactions within a single workspace. Docking jobs are organized within projects and can be revisited at any time through the Results tab. Docking jobs are organized within projects and can be accessed at any time through the Results tab. Before starting a prediction, ensure that:- A project has been created.
- Your protein sequence has been uploaded as a pdb file.
- You have sufficient compute credits available.
Need help uploading files? See the Uploading Files documentation.
Molecular Docking Workflow
The LiteFold docking workflow consists of six major stages:- Select a project
- Select a protein structure
- Configure the docking pocket
- Validate the binding site
- Select ligands
- Run docking and analyze results
Getting Started
Step 1: Open Molecular Docking
Navigate to:Lab → Molecular Docking
The Molecular Docking workspace is divided into two primary sections: Docking and Results.
The Docking tab is where users configure and launch docking experiments. From this workspace, protein structures can be selected, binding pockets can be defined manually or through AI-assisted pocket detection, ligands can be chosen, and docking jobs can be submitted for processing.
The Results tab provides access to completed and active docking runs. Users can monitor job progress, review docking scores, visualize predicted binding poses, analyze protein-ligand interactions, and download detailed docking reports for further study.
Step 2: Select a Project
Use the Project dropdown menu located at the top of the Molecular Docking workspace. Projects serve as the central workspace for molecular docking studies, helping users organize protein structures, ligands, docking jobs, and analysis results within a single environment. Select the project containing the protein structure you wish to use. Once selected, LiteFold automatically loads all available structure files associated with the project.Step 3: Select a Protein Structure
The left sidebar displays all available structure files within the selected project. Supported structures include:- Uploaded PDB files
- Prepared protein structures
- Structures generated through LiteFold Structure Prediction
Step 4: Pocket Configuration
Before docking can begin, a binding site must be defined. LiteFold provides two methods:Option 1: Enter Coordinates Manually
Select:Enter Coordinates
Specify:
- X, Y, Z Coordinate (Å)
- Search Radius
click: 'Validate'
This method is recommended when:
- Active-site coordinates are known
- Literature references are available
-
Experimental structures define the binding site
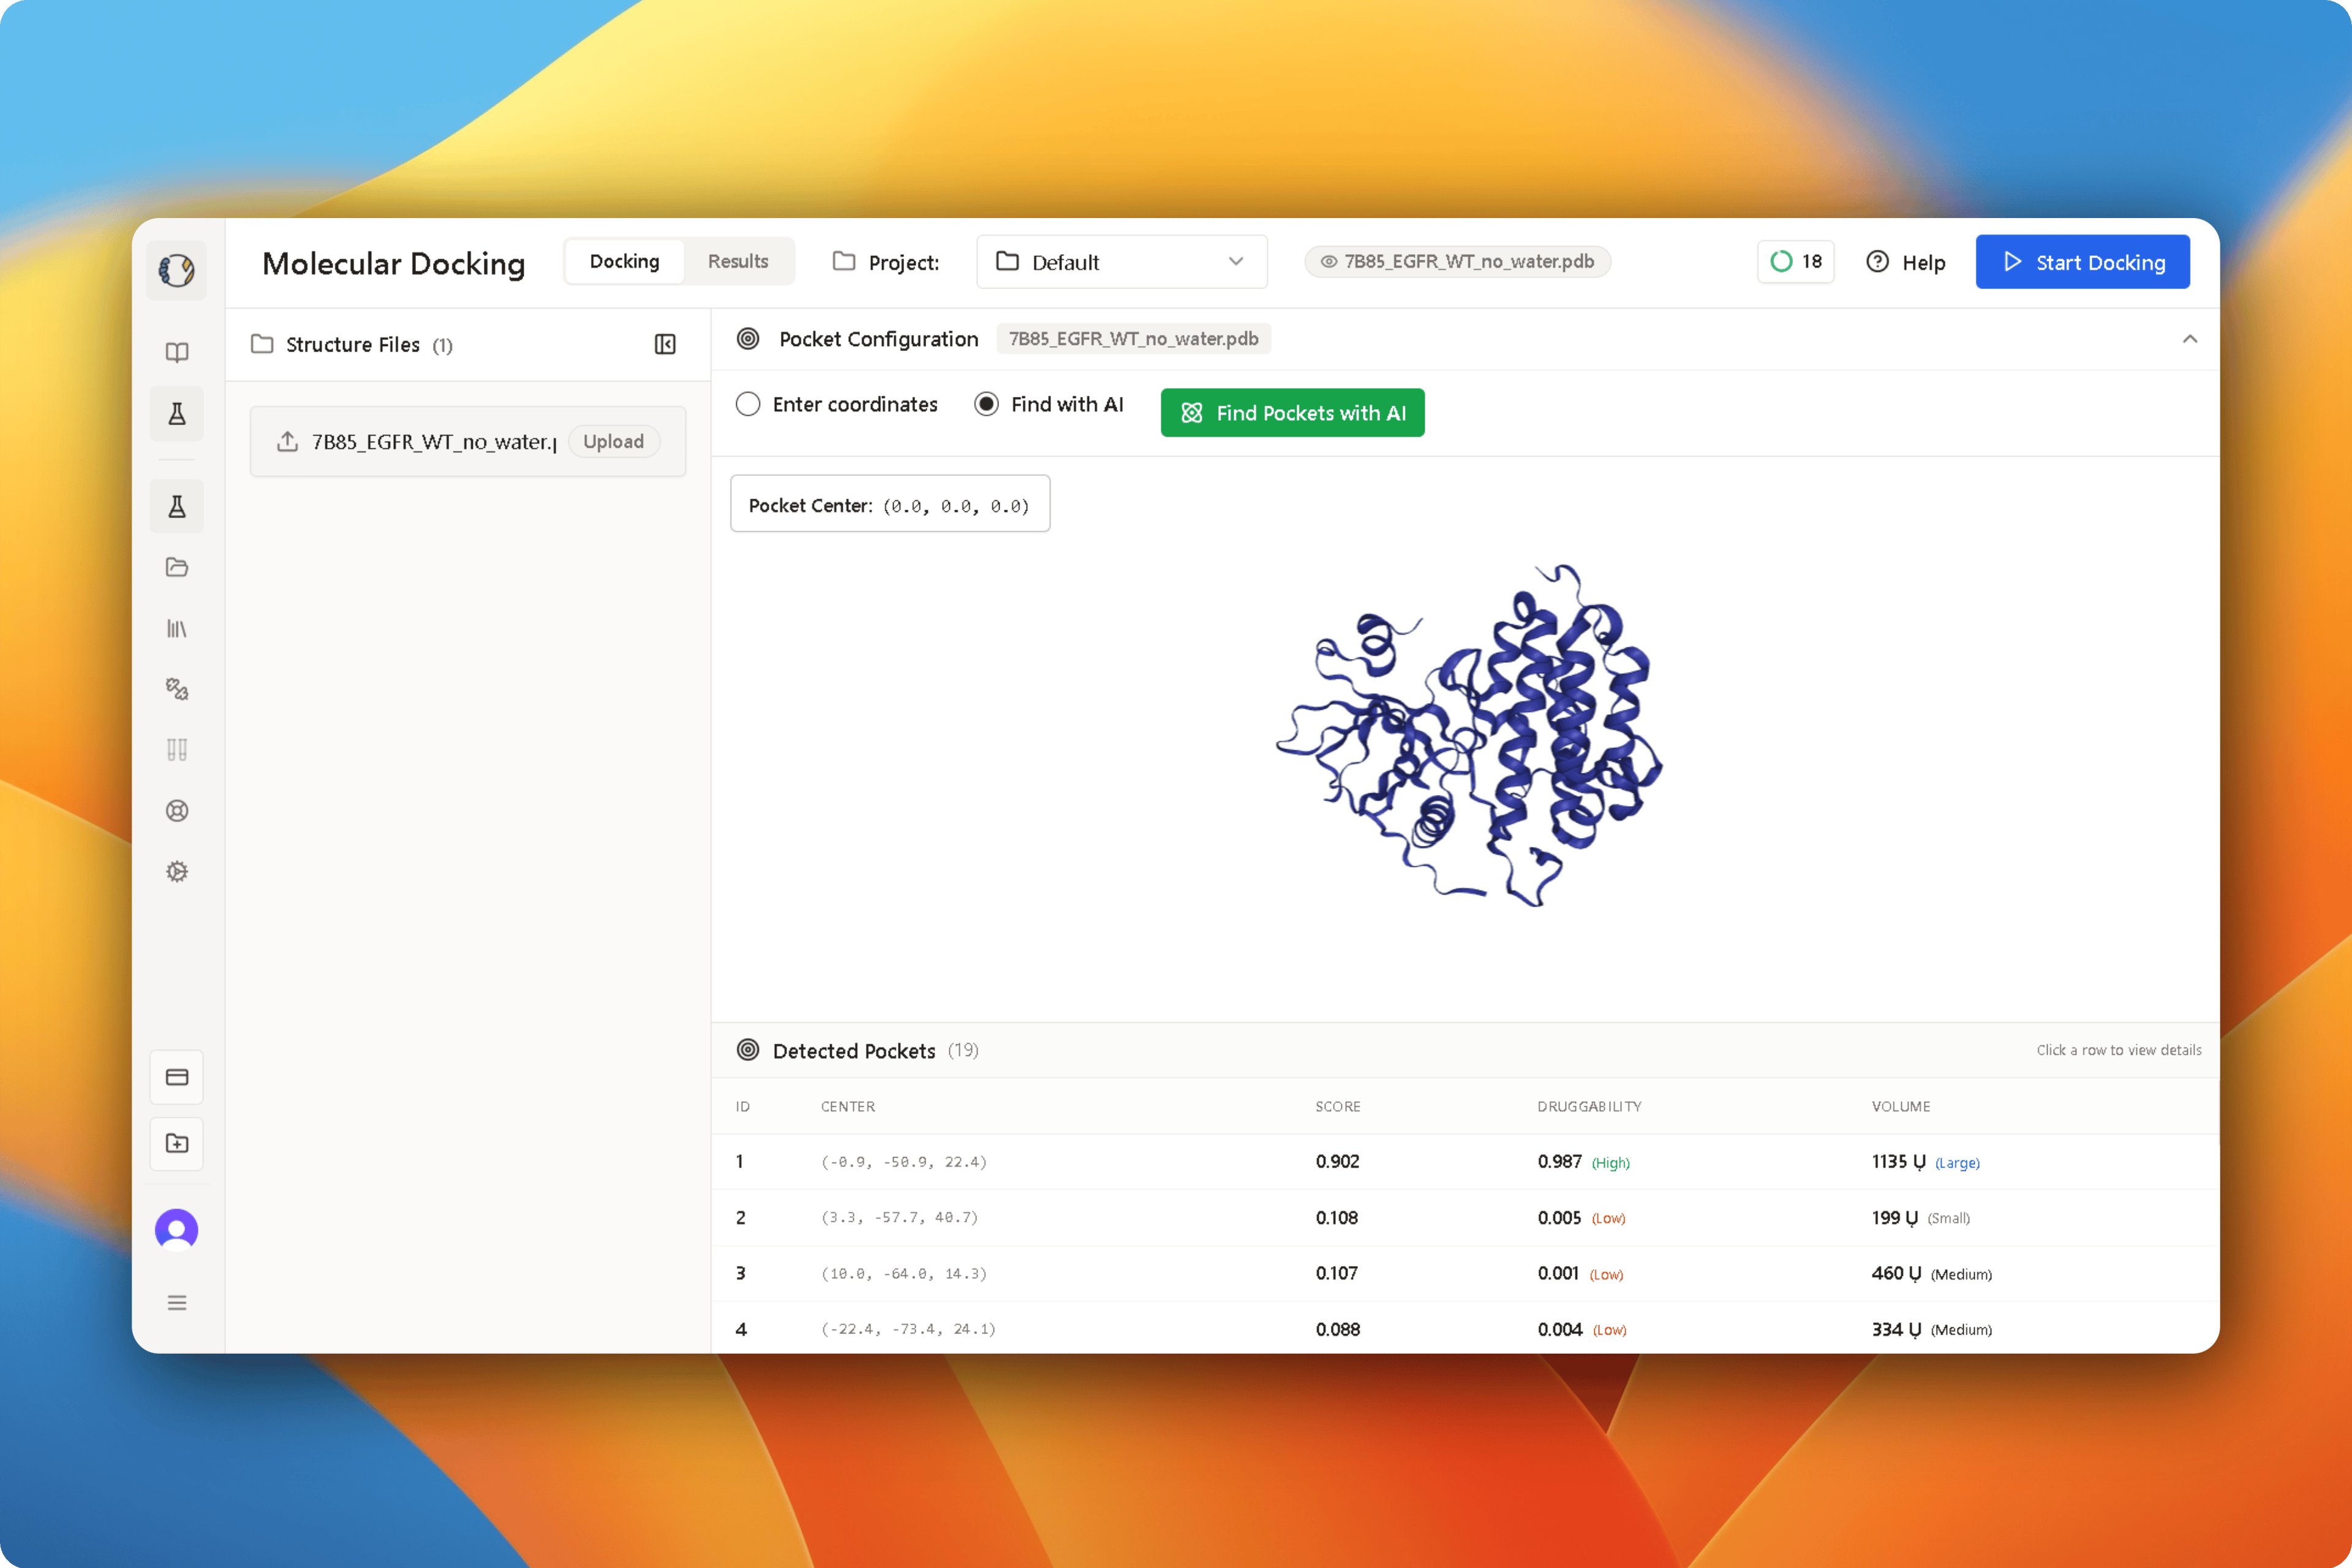
Option 2: Find Pockets with AI
Find with AI
Then click: Find Pockets with AI
LiteFold automatically analyzes the protein structure and predicts potential ligand-binding pockets.
During analysis, a notification indicates that pocket detection is running.
Reviewing Detected Pockets
Once pocket detection is complete, LiteFold generates a ranked list of candidate binding pockets. Each pocket is evaluated using geometric and structural features that help estimate its suitability for ligand binding. The detected pockets table includes the following information:
Confidence levels are reported as High, Medium, or Low and provide additional guidance when selecting a binding site for docking. Users should review both the pocket score and confidence score alongside the structural context visualized in the molecular viewer before proceeding.
Step 5: Pocket Analysis
Click any pocket row within the detected pocket table. Selecting a pocket automatically:- Loads the coordinates
- Updates the docking center
- Configures the docking region
Starting a Docking Job
After selecting the desired pocket, click:Start Docking
located in the upper-right corner of the Molecular Docking workspace.
The Docking Configuration window will appear.
Configure Docking Job
The docking configuration panel allows users to define docking parameters.Pocket Center Coordinates
The selected pocket coordinates are automatically populated. Displayed values include:- X, Y, Z coordinates
Select Ligands
The ligand selection panel serves as the entry point for choosing compounds to be docked against the selected protein target. It provides access to the project’s ligand collection, allowing users to browse, search, and manage available compounds before submission. Multiple ligands can be selected within a single docking run, enabling efficient screening and comparative binding analysis across a set of candidate molecules. Ligands can be selected individually or in bulk using the built-in selection tools. The search functionality makes it easy to locate specific compounds, while the “Select All Available” option can be used when screening multiple ligands against the same target. Examples:Box Size Configuration
The docking box defines the region explored during pose generation. Users may:- Use default dimensions
- Specify custom dimensions
Launch Docking
After selecting ligands and reviewing parameters:Click: 'Start Docking'
LiteFold submits the docking job to the processing queue.
Monitoring Docking Jobs
Navigate to:Results Tab
The Results page displays:
Possible statuses include:
- Queued
- Running
- Completed
- Failed
Opening Docking Results
Click: 'View'
on any completed docking job.
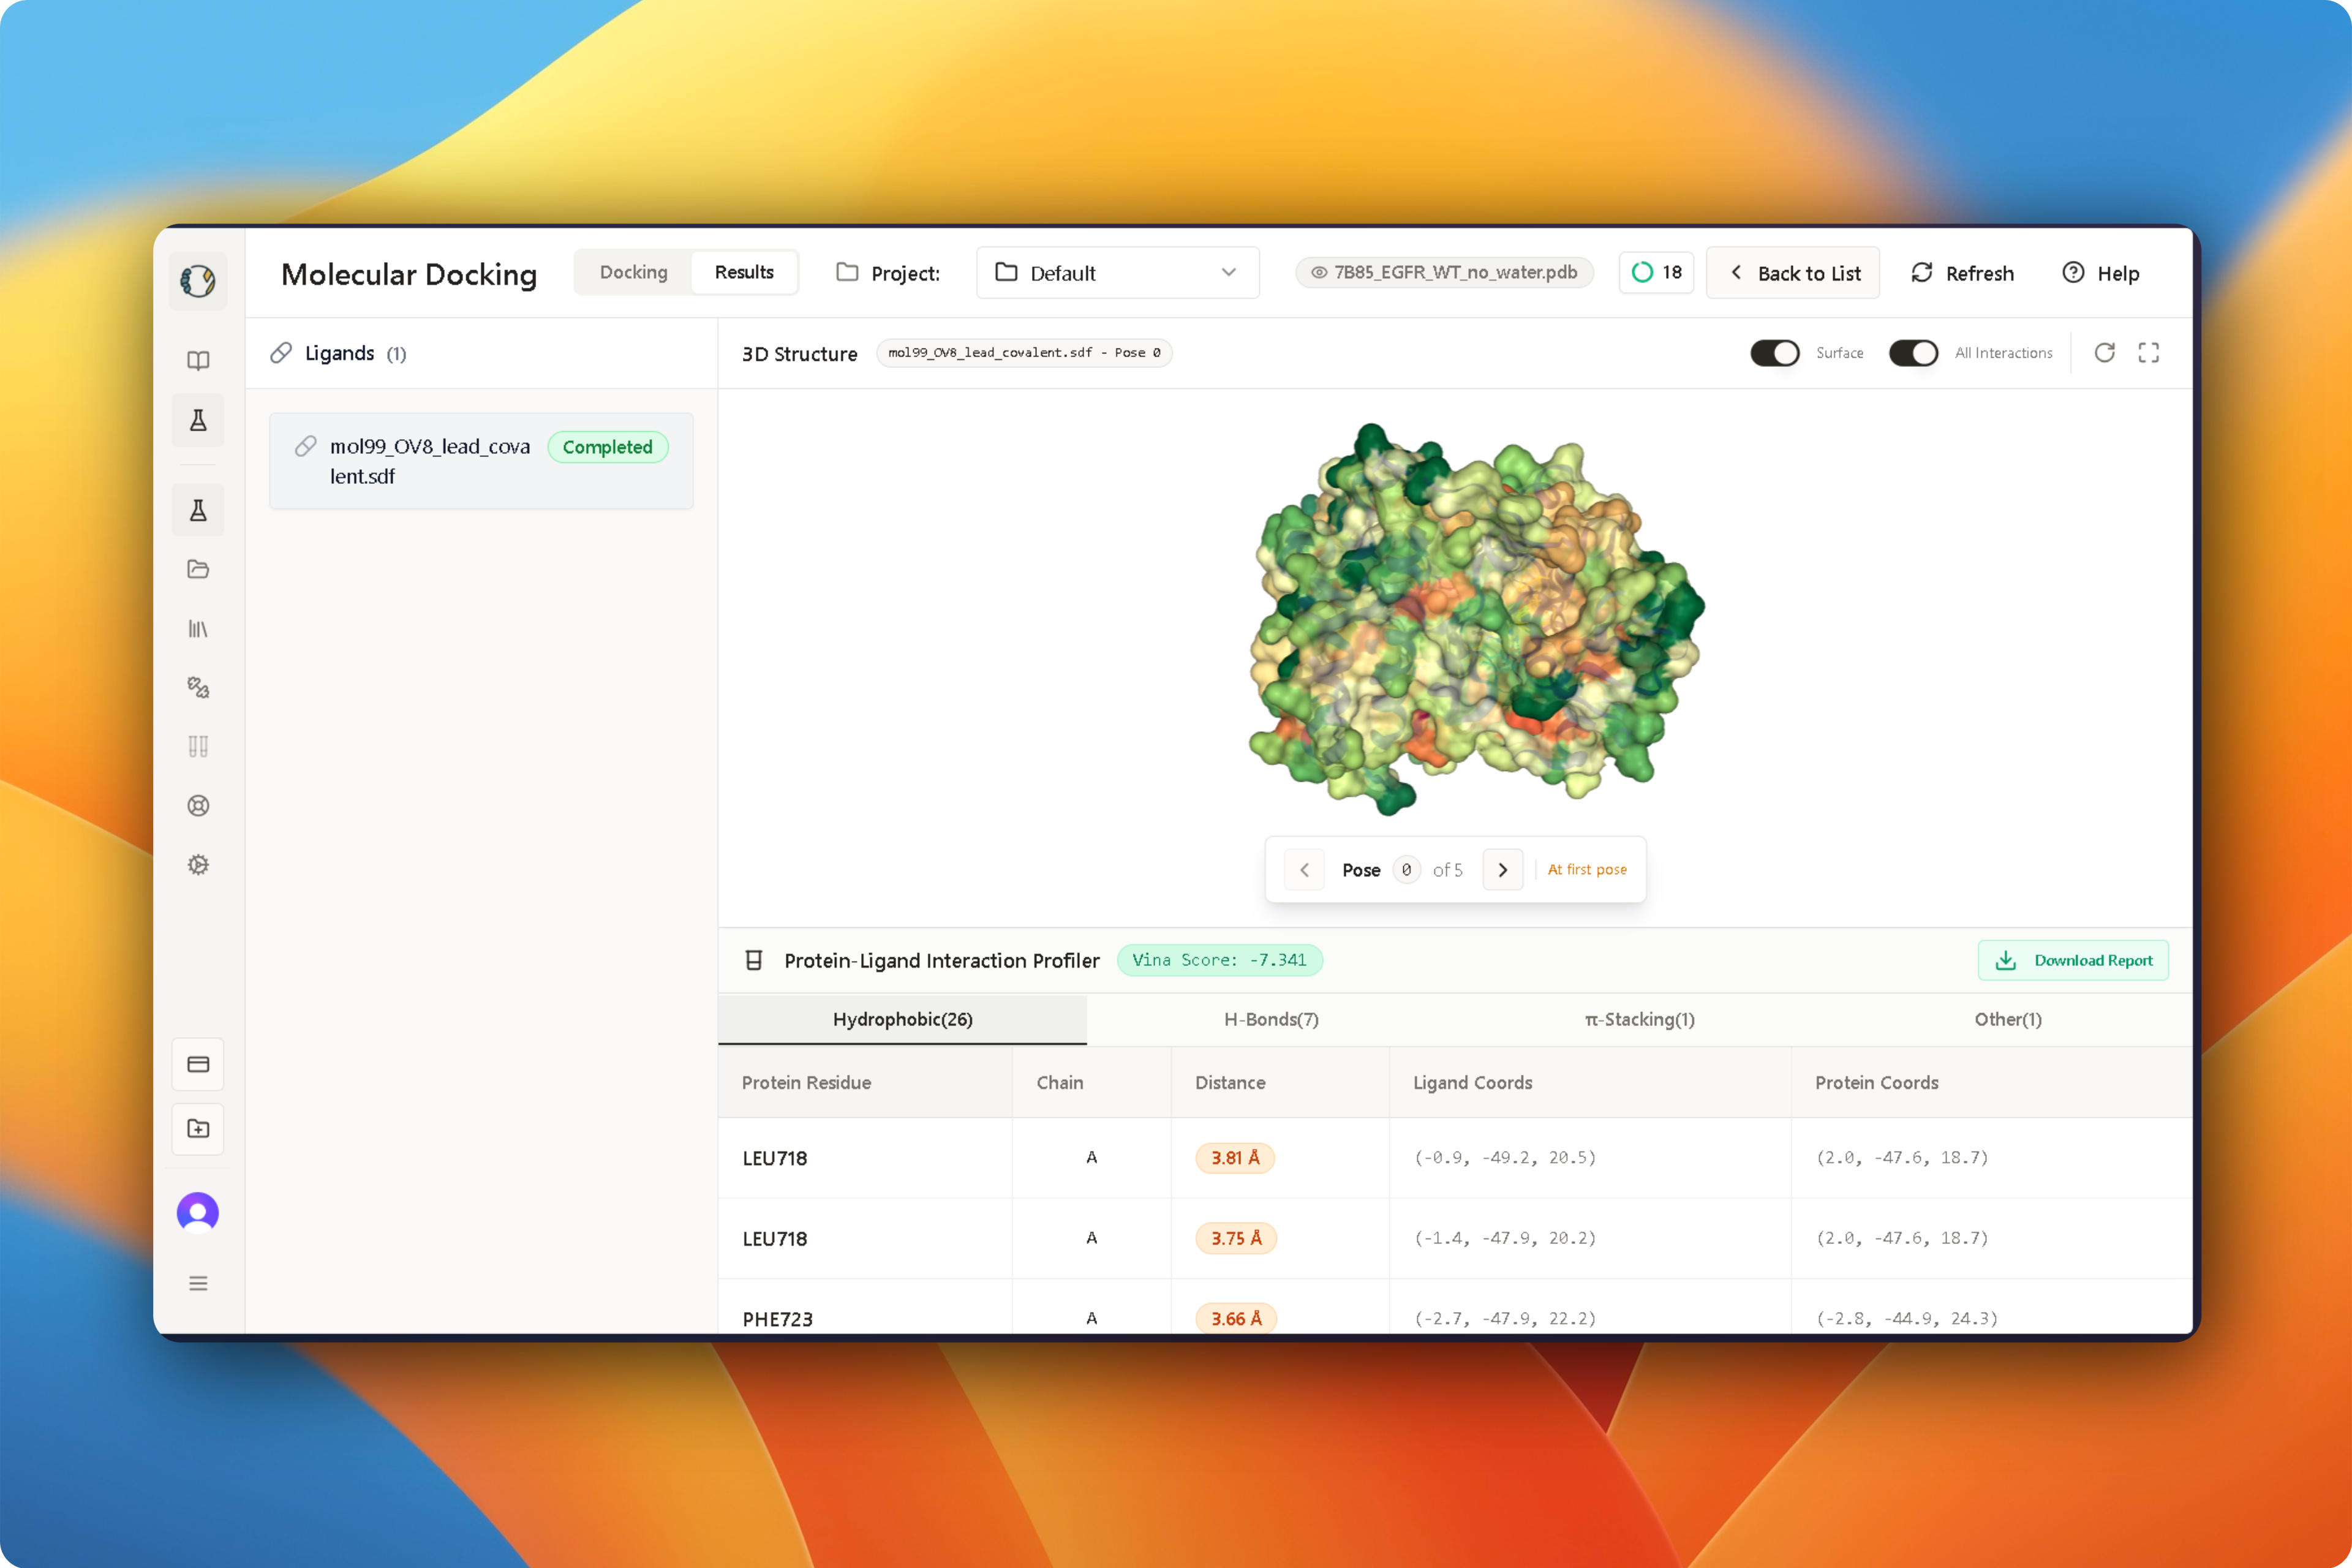
Upon opening a completed docking job, LiteFold presents a dedicated analysis workspace for reviewing docking results. This interface combines interactive 3D visualization, pose exploration tools, docking scores, interaction profiling, and report generation capabilities into a single view. By consolidating these analyses, users can efficiently assess ligand binding behavior, compare alternative poses, and identify promising candidates for downstream studies.
Understanding Docking Results
3D Structure Viewer
The central visualization panel provides an interactive view of the docked protein-ligand complex, allowing users to examine the predicted binding pose within its structural context. The viewer displays both the target protein and the selected ligand, enabling detailed inspection of binding-site geometry and molecular interactions. Users can freely rotate, zoom, and navigate the structure to explore ligand orientation, assess pocket occupancy, and compare alternative docking poses. These visualization tools help validate docking results by providing a clear view of how the ligand is positioned within the predicted binding site.Surface View
The Surface option displays the molecular surface surrounding the ligand. Useful for:- Assessing ligand burial
- Evaluating solvent exposure
- Examining pocket accessibility
Interaction View
The Interactions option highlights all detected contacts between the protein and ligand. This provides a rapid overview of the molecular interactions driving binding.Docking Poses
LiteFold generates multiple poses for each ligand. Users can:- Move between poses
- Compare alternative orientations
- Evaluate pose quality
Pose 1 of 5 Pose 2 of 5 Pose 3 of 5
Each pose represents a distinct predicted binding orientation within the pocket.
Docking Score
LiteFold reports a docking score for each pose. Example:Vina Score = -7.714 kcal/mol
Lower (more negative) values generally indicate stronger predicted binding.
Typical Score Interpretation
Docking scores should always be interpreted together with structural and interaction analysis.
Protein-Ligand Interaction Profiler
The Protein-Ligand Interaction Profiler provides a detailed analysis of the molecular contacts formed between the docked ligand and the target protein. By identifying and categorizing these interactions, the profiler helps researchers understand the factors contributing to binding affinity, specificity, and overall complex stability. Interactions are automatically classified into categories such as hydrophobic contacts, hydrogen bonds, π-stacking interactions, and other relevant molecular contacts. Each detected interaction is accompanied by detailed structural information, including the interacting protein residue, chain identifier, interaction distance, and the coordinates of both the ligand and protein atoms involved. This information enables users to evaluate binding quality, identify key residues involved in ligand recognition, and compare interaction patterns across multiple docking poses.Hydrophobic Interactions
Hydrophobic contacts occur when nonpolar regions of the protein and ligand interact. Common residues include:- LEU
- VAL
- ILE
- PHE
- MET
3.5 Å – 5.0 Å
These interactions contribute significantly to binding stability.
Hydrogen Bonds
Hydrogen bonds are critical for molecular recognition and binding specificity. A hydrogen bond forms between:- Donor atom (D)
- Hydrogen atom (H)
- Acceptor atom (A)
2.5 Å – 3.5 Å
Distance Formula
The distance between two interacting atoms is calculated using: Where: x,y,z represent atomic coordinates d represents interatomic distance Shorter distances generally indicate stronger interactions.π-Stacking Interactions
π-Stacking interactions occur between aromatic systems. Examples include interactions involving:- Phenylalanine
- Tyrosine
- Tryptophan
- Aromatic ligand scaffolds
4.5 Å – 7.0 Å
These interactions often contribute substantially to binding affinity.
Downloading Reports
Completed docking analyses can be exported using:Download Report
The report contains:
Docking Summary
The Docking Summary provides a high-level overview of the completed docking experiment. It includes information about the selected protein target, the docked ligand, the binding-site coordinates used during the simulation, and the docking configuration applied during job execution. This section serves as a quick reference for understanding the overall setup of the docking run.Docking Results
The Docking Results section presents the primary outputs generated during the docking process, including docking scores, ranked binding poses, and pose-specific statistics. These results help users evaluate ligand binding potential and compare alternative docking conformations.Interaction Analysis
The Interaction Analysis section provides a detailed breakdown of the molecular interactions detected between the ligand and protein. LiteFold automatically identifies key contacts such as hydrophobic interactions, hydrogen bonds, π-stacking interactions, and other non-covalent interactions that contribute to binding affinity and molecular recognition.Structural Information
Structural Information contains the spatial and geometric data associated with the docked complex. This includes protein-ligand coordinates, binding-site characteristics, and pose-specific structural details that can be used for visualization, further analysis, or downstream computational workflows.Reproducibility Information
To support reproducibility and experimental transparency, LiteFold records all parameters used during the docking run. This includes docking settings, search-space dimensions, pocket coordinates, and other configuration details required to reproduce the analysis at a later stage. The generated docking report serves as a comprehensive record of the experiment and can be used for research documentation, collaboration, project tracking, publication preparation, and lead optimization studies.Best Practices
Verify Pocket Selection
Review AI-detected pockets before launching docking calculations.Inspect Docking Poses
Do not rely solely on docking scores. Always examine:- Binding orientation
- Key residue contacts
- Pocket occupancy
Compare Multiple Poses
The highest-scoring pose may not always be biologically meaningful. Review alternative poses when available.Screen Multiple Ligands
Evaluating multiple compounds improves hit identification and prioritization.Validate Experimentally
Docking predictions should be treated as computational hypotheses and confirmed through experimental assays.Integration with LiteFold
Molecular Docking integrates directly with:- Structure Prediction
- Design
- DeNovo
- Rosalind
Next Steps
Lead optimization
Validate docking with MD simulations
De Novo Design
Design novel molecules based on docking insights
Binding Affinity
Calculate precise binding free energies
Compound Screening
Complete virtual screening workflows