

Key Features
- AI-powered protein structure prediction
- Simple sequence-based prediction workflow
- Interactive structure visualization
- Downloadable structure files for downstream analysis
- Integration with LiteFold molecular docking workflows
- Integration with molecular dynamics simulations
- Fast prediction turnaround for research applications
Available Models
Boltz-2Supported Prediction Tasks
LiteFold supports both individual protein structure prediction and multi-component biological assemblies. Supported prediction workflows include:
These prediction modes enable researchers to study binding interfaces, signaling complexes, regulatory proteins, enzyme-substrate interactions, and drug-target systems from a unified workflow.
Quick Start
This guide walks through the complete workflow for generating protein structures in LiteFold using Boltz-2.Before You Begin
Before starting a prediction, ensure that:- A project has been created.
- Your protein sequence has been uploaded as a FASTA file.
- You have sufficient compute credits available.
Need help uploading files? See: Uploading Files to LiteFold
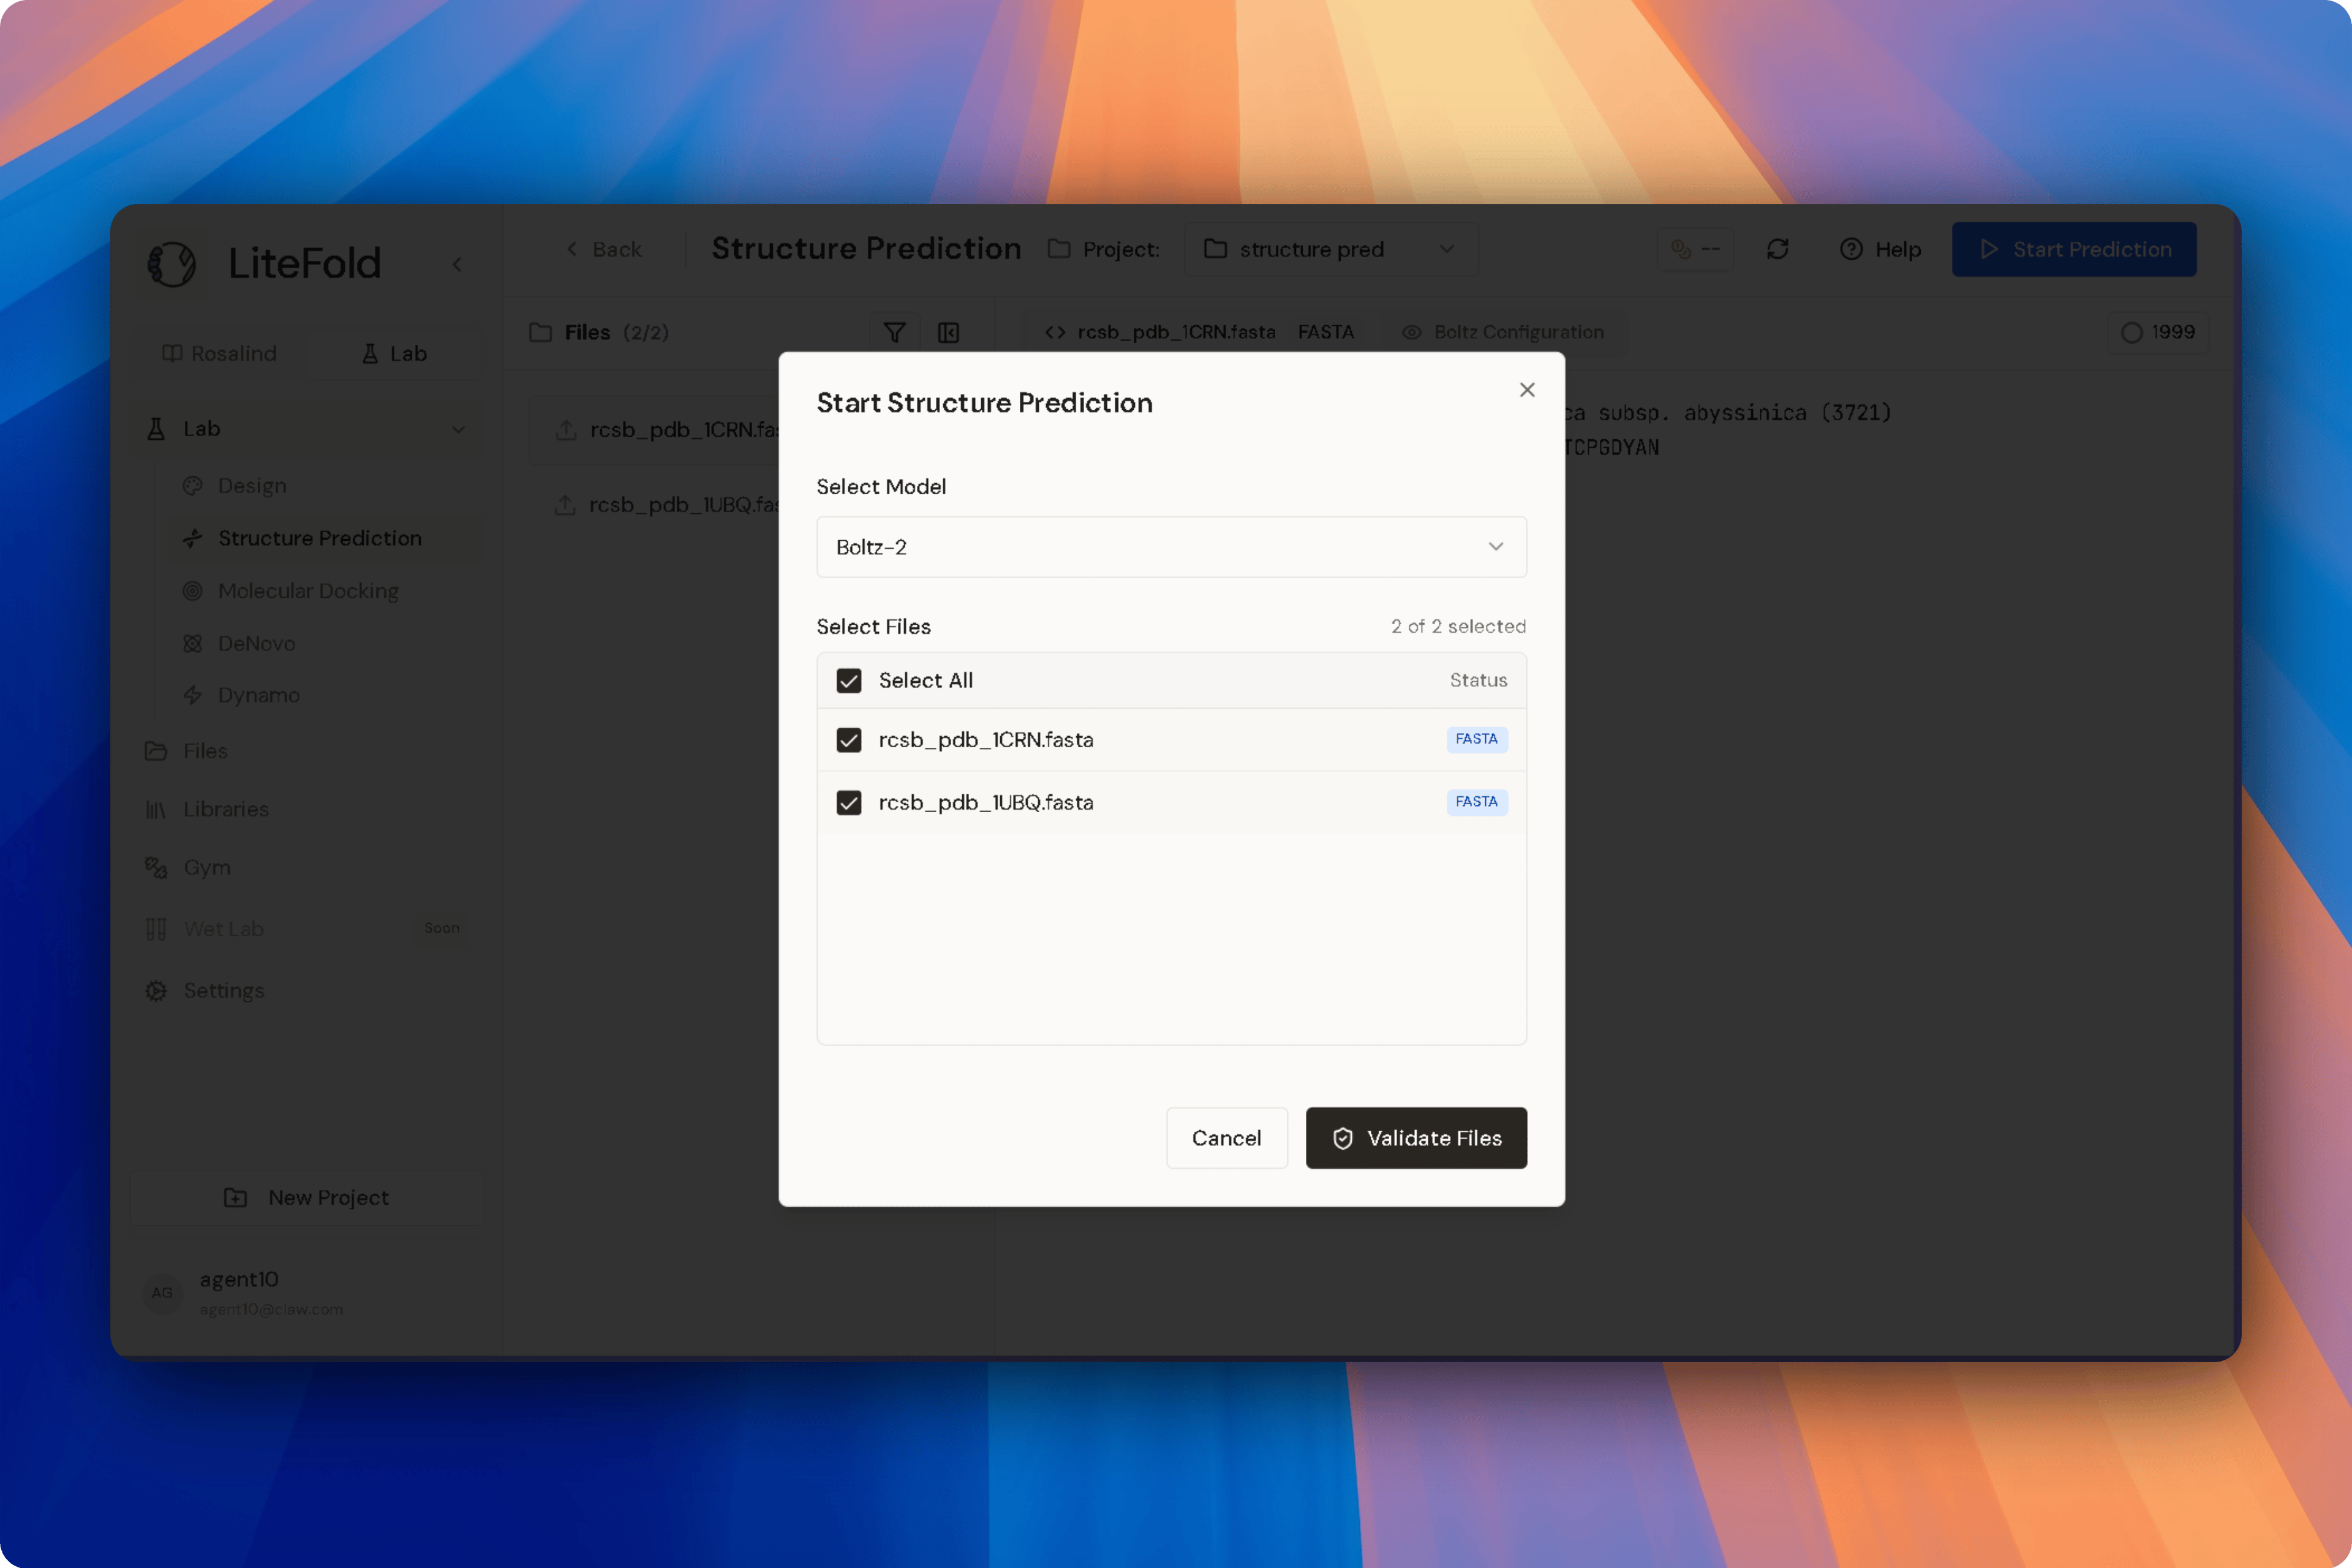
Step 1: Open the Structure Prediction Module
From the LiteFold Lab dashboard:- Navigate to Lab.
- Select Structure Prediction from the sidebar.
Step 2: Select a Project
Use the Project dropdown menu to choose the project where your prediction will be created. Projects help organize prediction jobs, input files, and generated structures.Step 3: Create a New Structure Prediction
After selecting a project:- Open the project.
- Create a new structure prediction job.
Step 4: Review Input Sequences
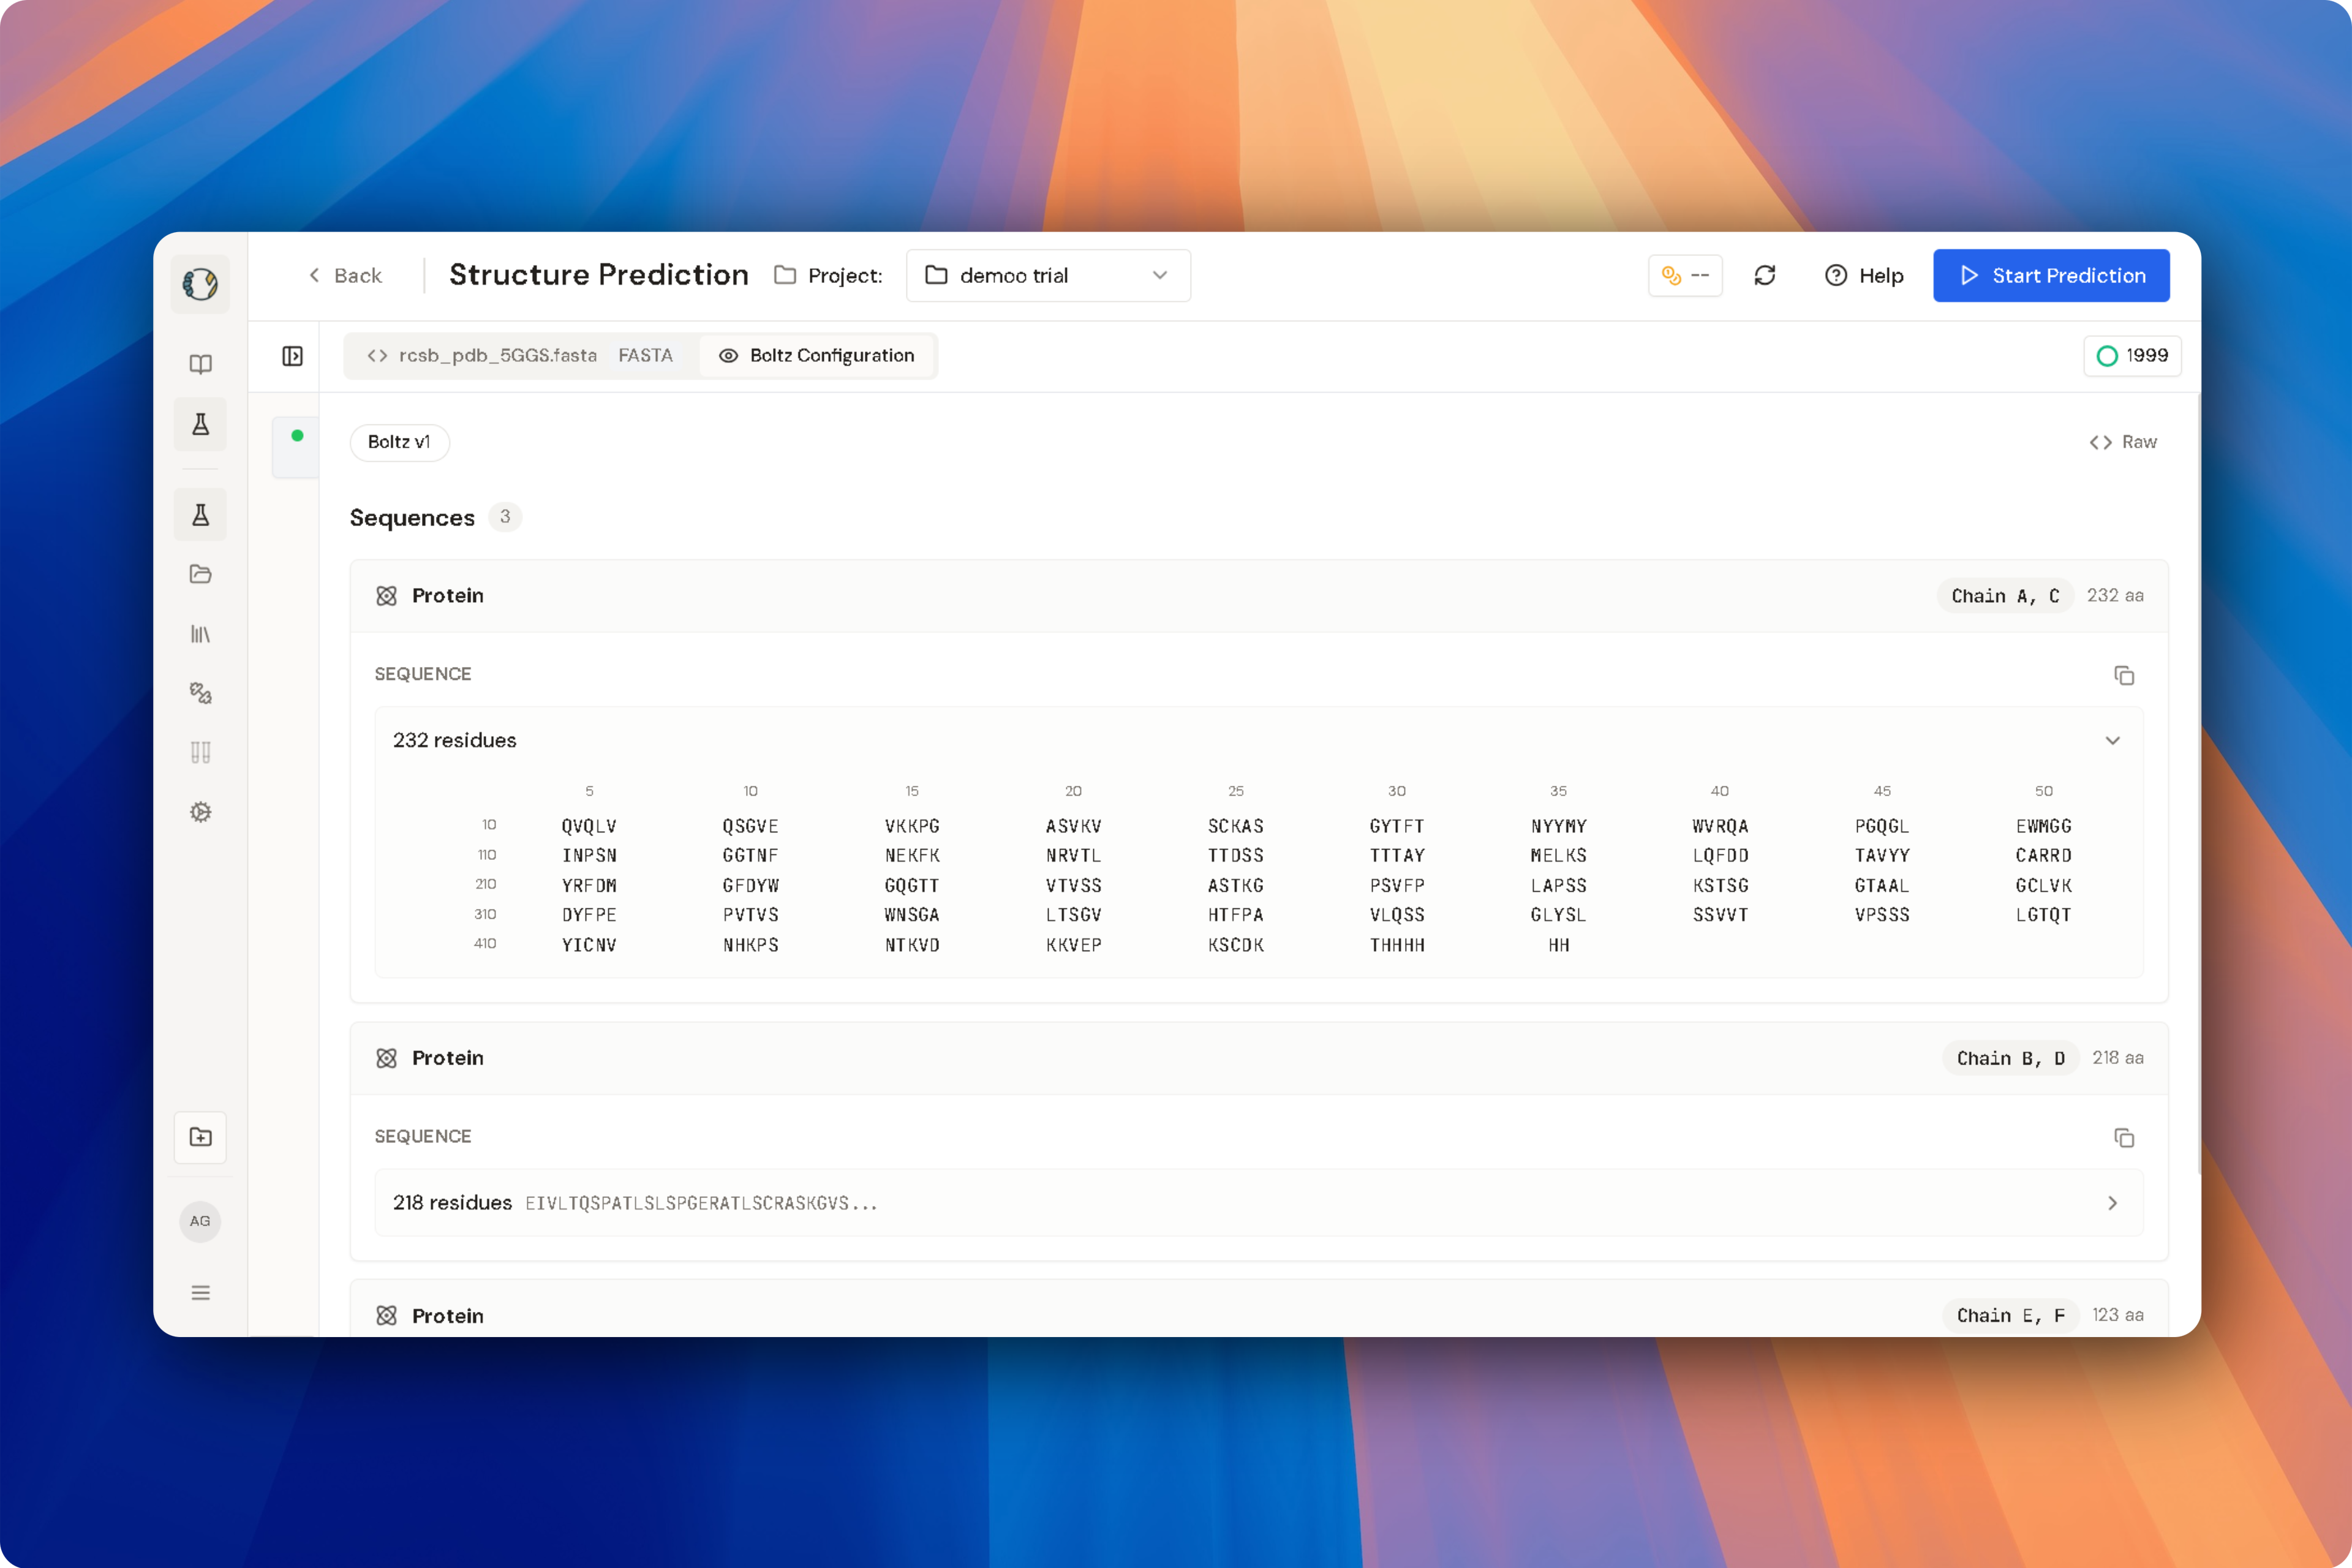
Select one or more FASTA files that will be included in the prediction. LiteFold displays:- Protein sequences
- Chain assignments
- Residue counts
- Sequence composition
- Molecular component types
Multi-Sequence and Complex Prediction
LiteFold supports the submission of multiple FASTA entries within a single prediction job. This capability enables prediction of:- Protein-protein complexes
- Protein-ligand systems
- Protein-RNA assemblies
- Protein-DNA assemblies
- Multi-component biological complexes
Example
Step 5: Review Boltz Configuration (Optional)
Before running the prediction, you may review the Boltz Configuration tab. The configuration panel provides information about:- Selected prediction engine
- Sequence interpretation
- Chain assignments
- Model-specific settings
Step 6: Start a Prediction
Click Start Prediction in the upper-right corner. A prediction setup dialog will appear.Step 7: Select the Prediction Model
Choose the model that will be used for structure generation. Available models include:Boltz-2
Recommended for most prediction tasks. Provides:- High-quality structure prediction
- Multi-chain support
- Fast inference
- Strong performance on protein complexes
Step 8: Select Input Files
Choose the FASTA file(s) to include in the prediction job. You may:- Select individual files
- Select multiple files
- Use Select All
Step 9: Validate Files
Click Validate Files. LiteFold performs automatic validation checks, including:- FASTA format verification
- Sequence integrity checks
- Input compatibility checks
- Model readiness verification
Step 10: Launch the Prediction
Click Start Prediction to submit the job. LiteFold will:- Queue the prediction task.
- Allocate computational resources.
- Begin structure generation.
- Track job progress automatically.
Monitoring Prediction Progress
After submission, return to the Structure Prediction Home Page. The dashboard displays:- Running predictions
- Queued jobs
- Completed predictions
- Failed jobs (if any)
- Historical prediction records
Understanding Results
Once a prediction has completed, LiteFold automatically generates a detailed results page where you can inspect the predicted structure, evaluate confidence metrics, save results to your project, and download structure files for downstream analysis. The results workspace combines interactive visualization with quantitative quality metrics, allowing researchers to quickly assess whether a predicted structure is suitable for further study.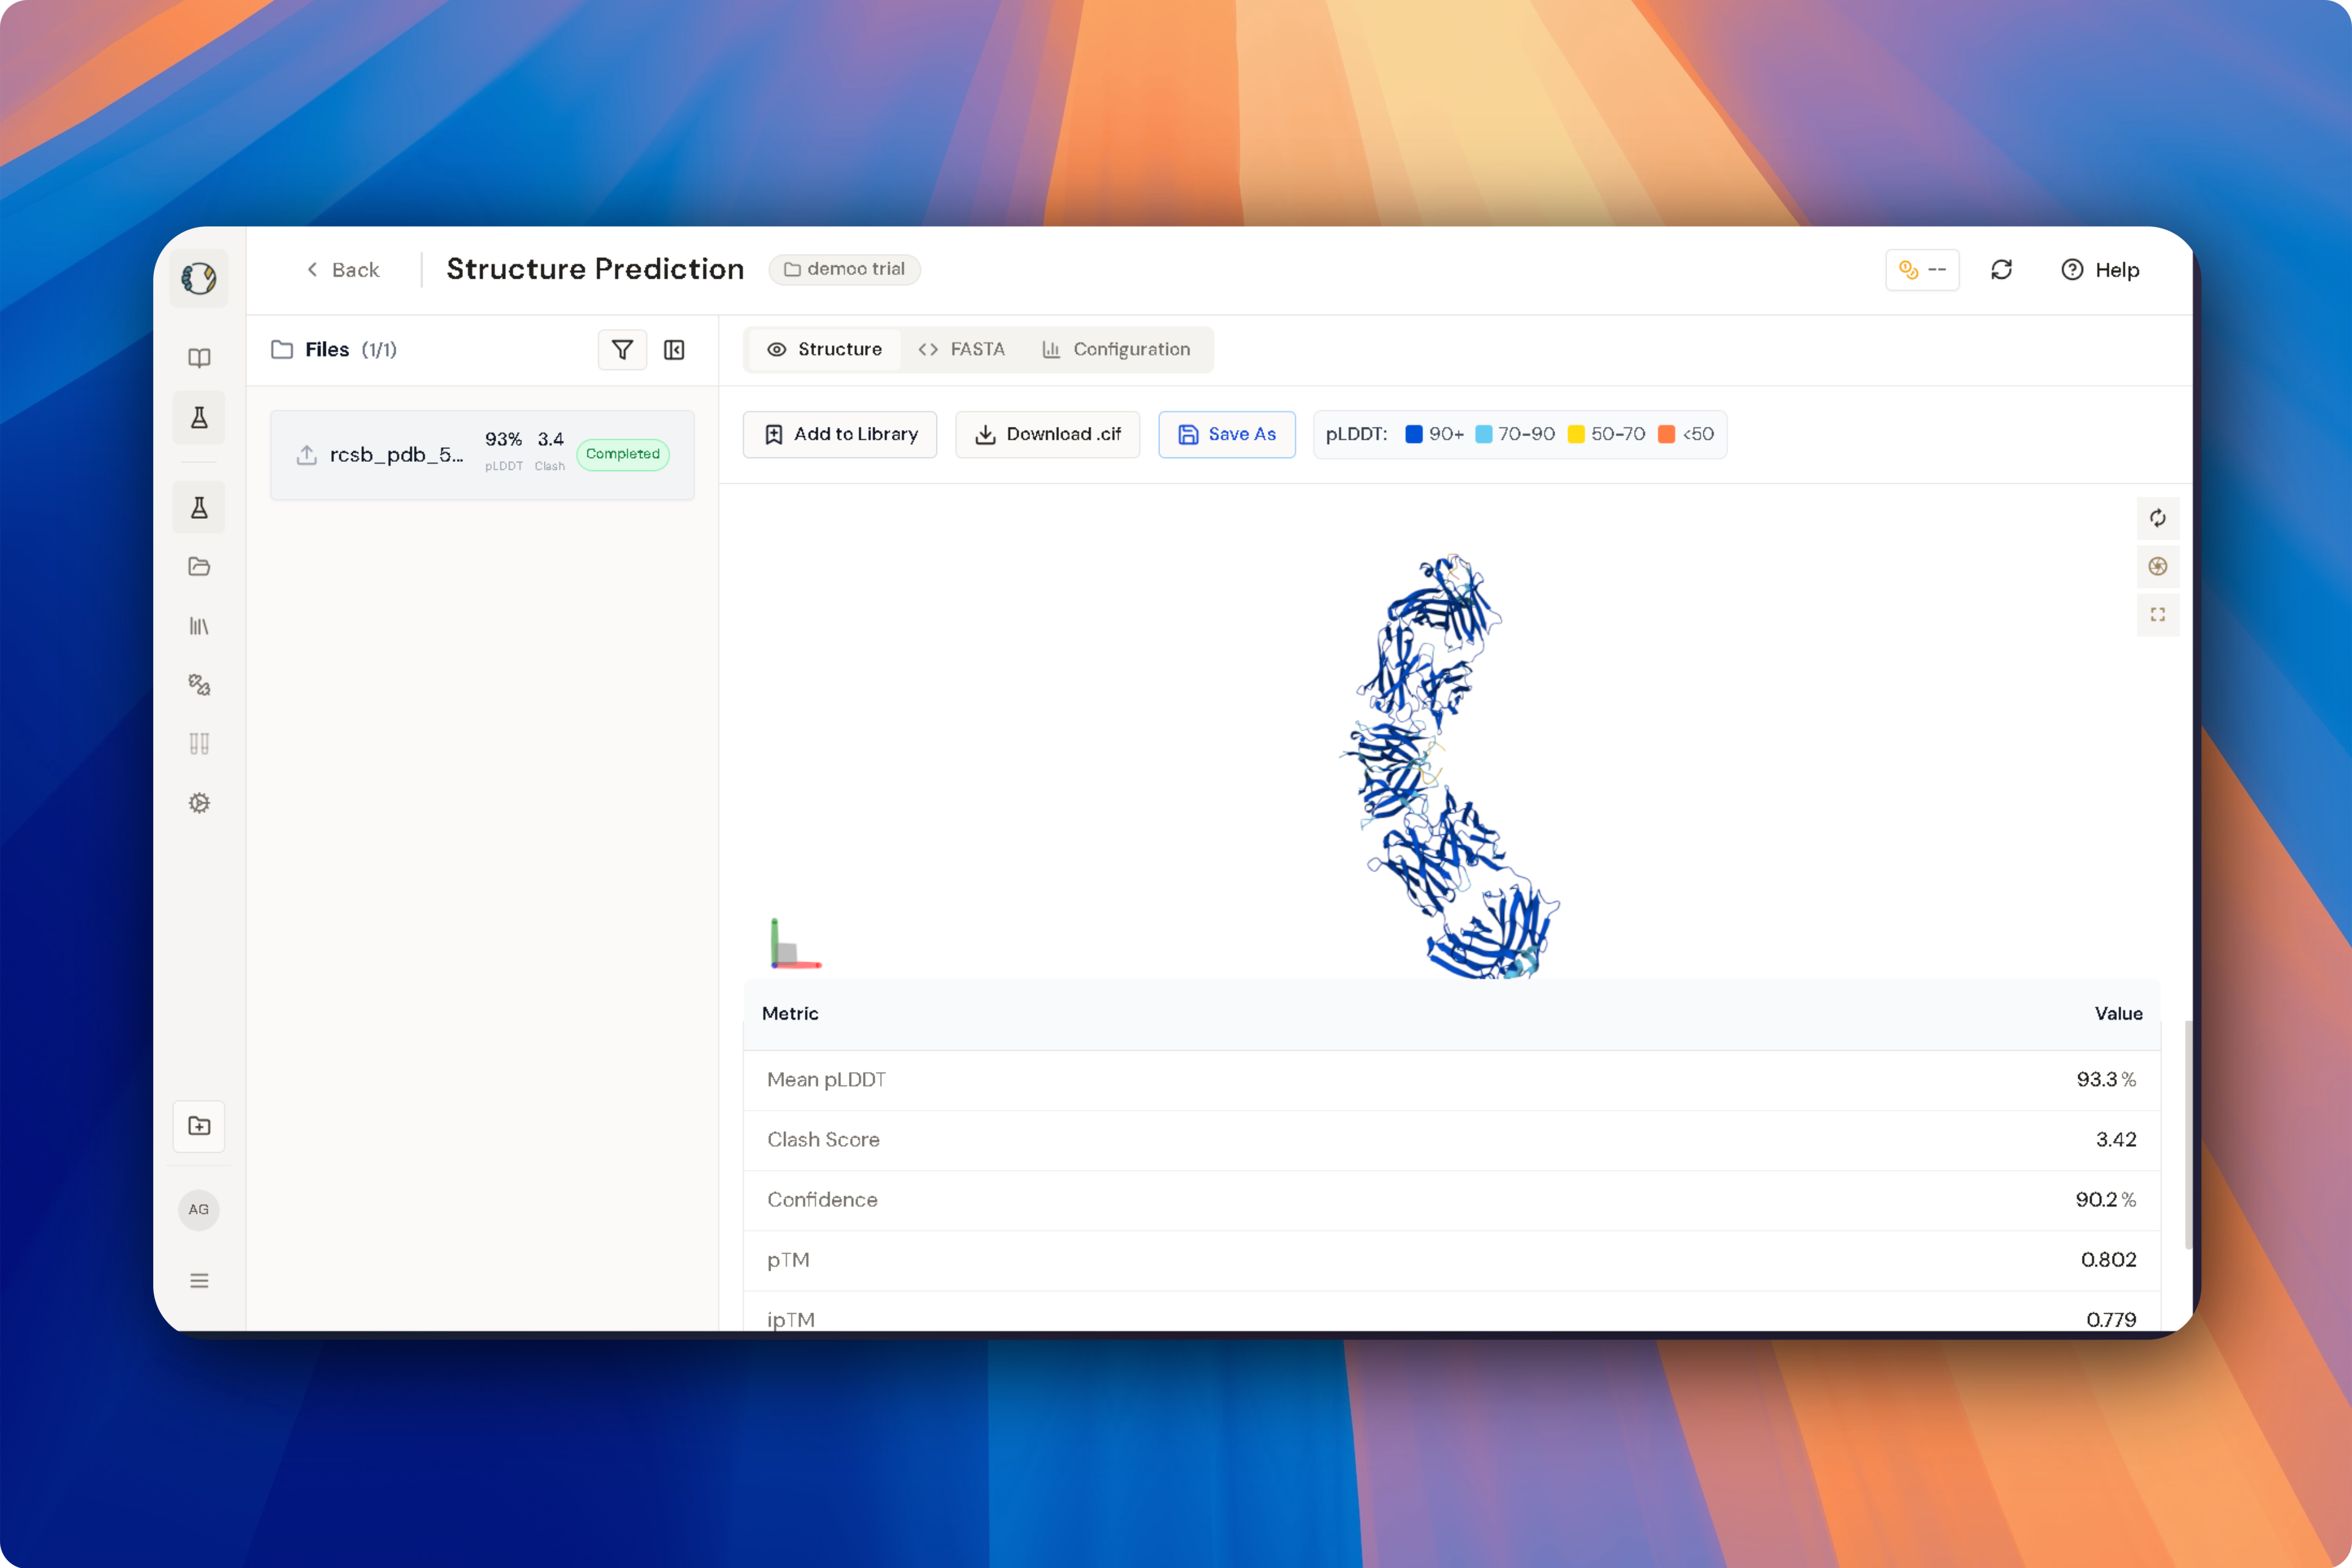
Overview
The results page provides:- Interactive 3D structure visualization
- Confidence metrics
- Structure quality assessment
- Prediction model information
- File export options
- Project organization tools
Structure Visualization
The Structure tab displays an interactive three-dimensional representation of the predicted protein. The viewer allows you to:- Rotate the structure
- Zoom in and out
- Inspect individual regions
- Examine chain organization
- Analyze folded domains
- Review confidence coloring
Confidence Coloring (pLDDT)
LiteFold automatically colors the predicted structure according to pLDDT confidence scores. For residue i: Based on the Local Distance Difference Test: Where:- denotes the predicted distance.
- denotes the experimental distance.
- represents the distance threshold.
- represents the neighboring residues.
- is the indicator function.
Regions displayed in dark blue are generally the most reliable portions of the prediction.
Prediction Metrics
Below the structure viewer, LiteFold provides several quality metrics to help evaluate prediction reliability.Mean pLDDT
Mean pLDDT represents the average confidence score across all residues in the structure. Where: N = total residues Example:Mean pLDDT: 93.3%
Interpretation:
- Above 90 → Very high confidence
- 70–90 → Reliable prediction
- 50–70 → Moderate confidence
- Below 50 → Low confidence
Confidence Score
The overall confidence score summarizes the model’s confidence in the generated structure. Where: w1+w2+w3=1 w1+w2+w3=1 Example:Confidence: 90.2%
Structures with higher confidence scores are typically better candidates for downstream applications such as docking and molecular dynamics.
Clash Score
The Clash Score measures steric overlaps between atoms. Example:Clash Score: 3.42
Lower clash scores generally indicate better structural geometry and fewer unrealistic atomic contacts.
pTM Score
The Predicted Template Modeling (pTM) score evaluates overall structural accuracy. Example:pTM: 0.802
pTM values range from 0 to 1.
ipTM Score
For multi-chain complexes, LiteFold reports the Interface Predicted Template Modeling (ipTM) score. Example:ipTM: 0.779
This metric estimates confidence in the predicted interactions between biological components within a complex.
Depending on the prediction setup, ipTM may be used to assess:
- Protein-protein interfaces
- Protein-ligand interactions
- Protein-RNA interfaces
- Protein-DNA interfaces
For protein-protein, protein-ligand, protein-RNA, and protein-DNA predictions, interface-focused metrics are particularly important when assessing biological relevance.
Prediction Model
The metrics table also records the model used to generate the structure. Example:Model: Boltz
This allows researchers to track which prediction engine produced a particular result.
Saving Results
LiteFold allows completed predictions to be assigned a custom alias and stored within your project for easier organization. Click Save As to open the save dialog.Creating an Alias
An alias provides a more meaningful name for the prediction. Examples:- KRAS_G12D_Prediction
- EGFR_T790M_Model
- B2AR_Active_State
Adding Results to Libraries
Predicted structures can optionally be added to a LiteFold Library for later reuse across projects and workflows. This is useful for:- Frequently used targets
- Reference structures
- Shared project resources
Converting to Additional Formats
During the save process, LiteFold can optionally convert the prediction into additional structure formats. Supported formats may include:- CIF
- PDB
- PDBQT
Downloading Structure Files
Predicted structures can be downloaded directly from the results page. Click Download .cif to export the structure.CIF Format
The Crystallographic Information File (CIF) format contains:- Atomic coordinates
- Structural annotations
- Chain information
- Residue information
Best Practices
Before proceeding to downstream analysis:- Review the Mean pLDDT score.
- Check confidence coloring in critical regions.
- Examine clash scores for structural quality.
- Verify interface quality using ipTM for complexes.
- Save important predictions using descriptive aliases.
- Download structures for archival and external analysis.
- Save the structure to your project.
- Add it to a LiteFold Library.
- Download the CIF file.
- Use the structure in Molecular Docking workflows.
- Run Molecular Dynamics simulations.
- Continue with De Novo Design and drug discovery pipelines.
Next Steps
Molecular Docking
Dock ligands to your predicted structure
Molecular Dynamics
Validate and refine with MD simulations
De Novo Design
Design molecules for your structure
Workflows
End-to-end drug discovery workflows